
New database aims to highlight housing needs ahead of the municipal election
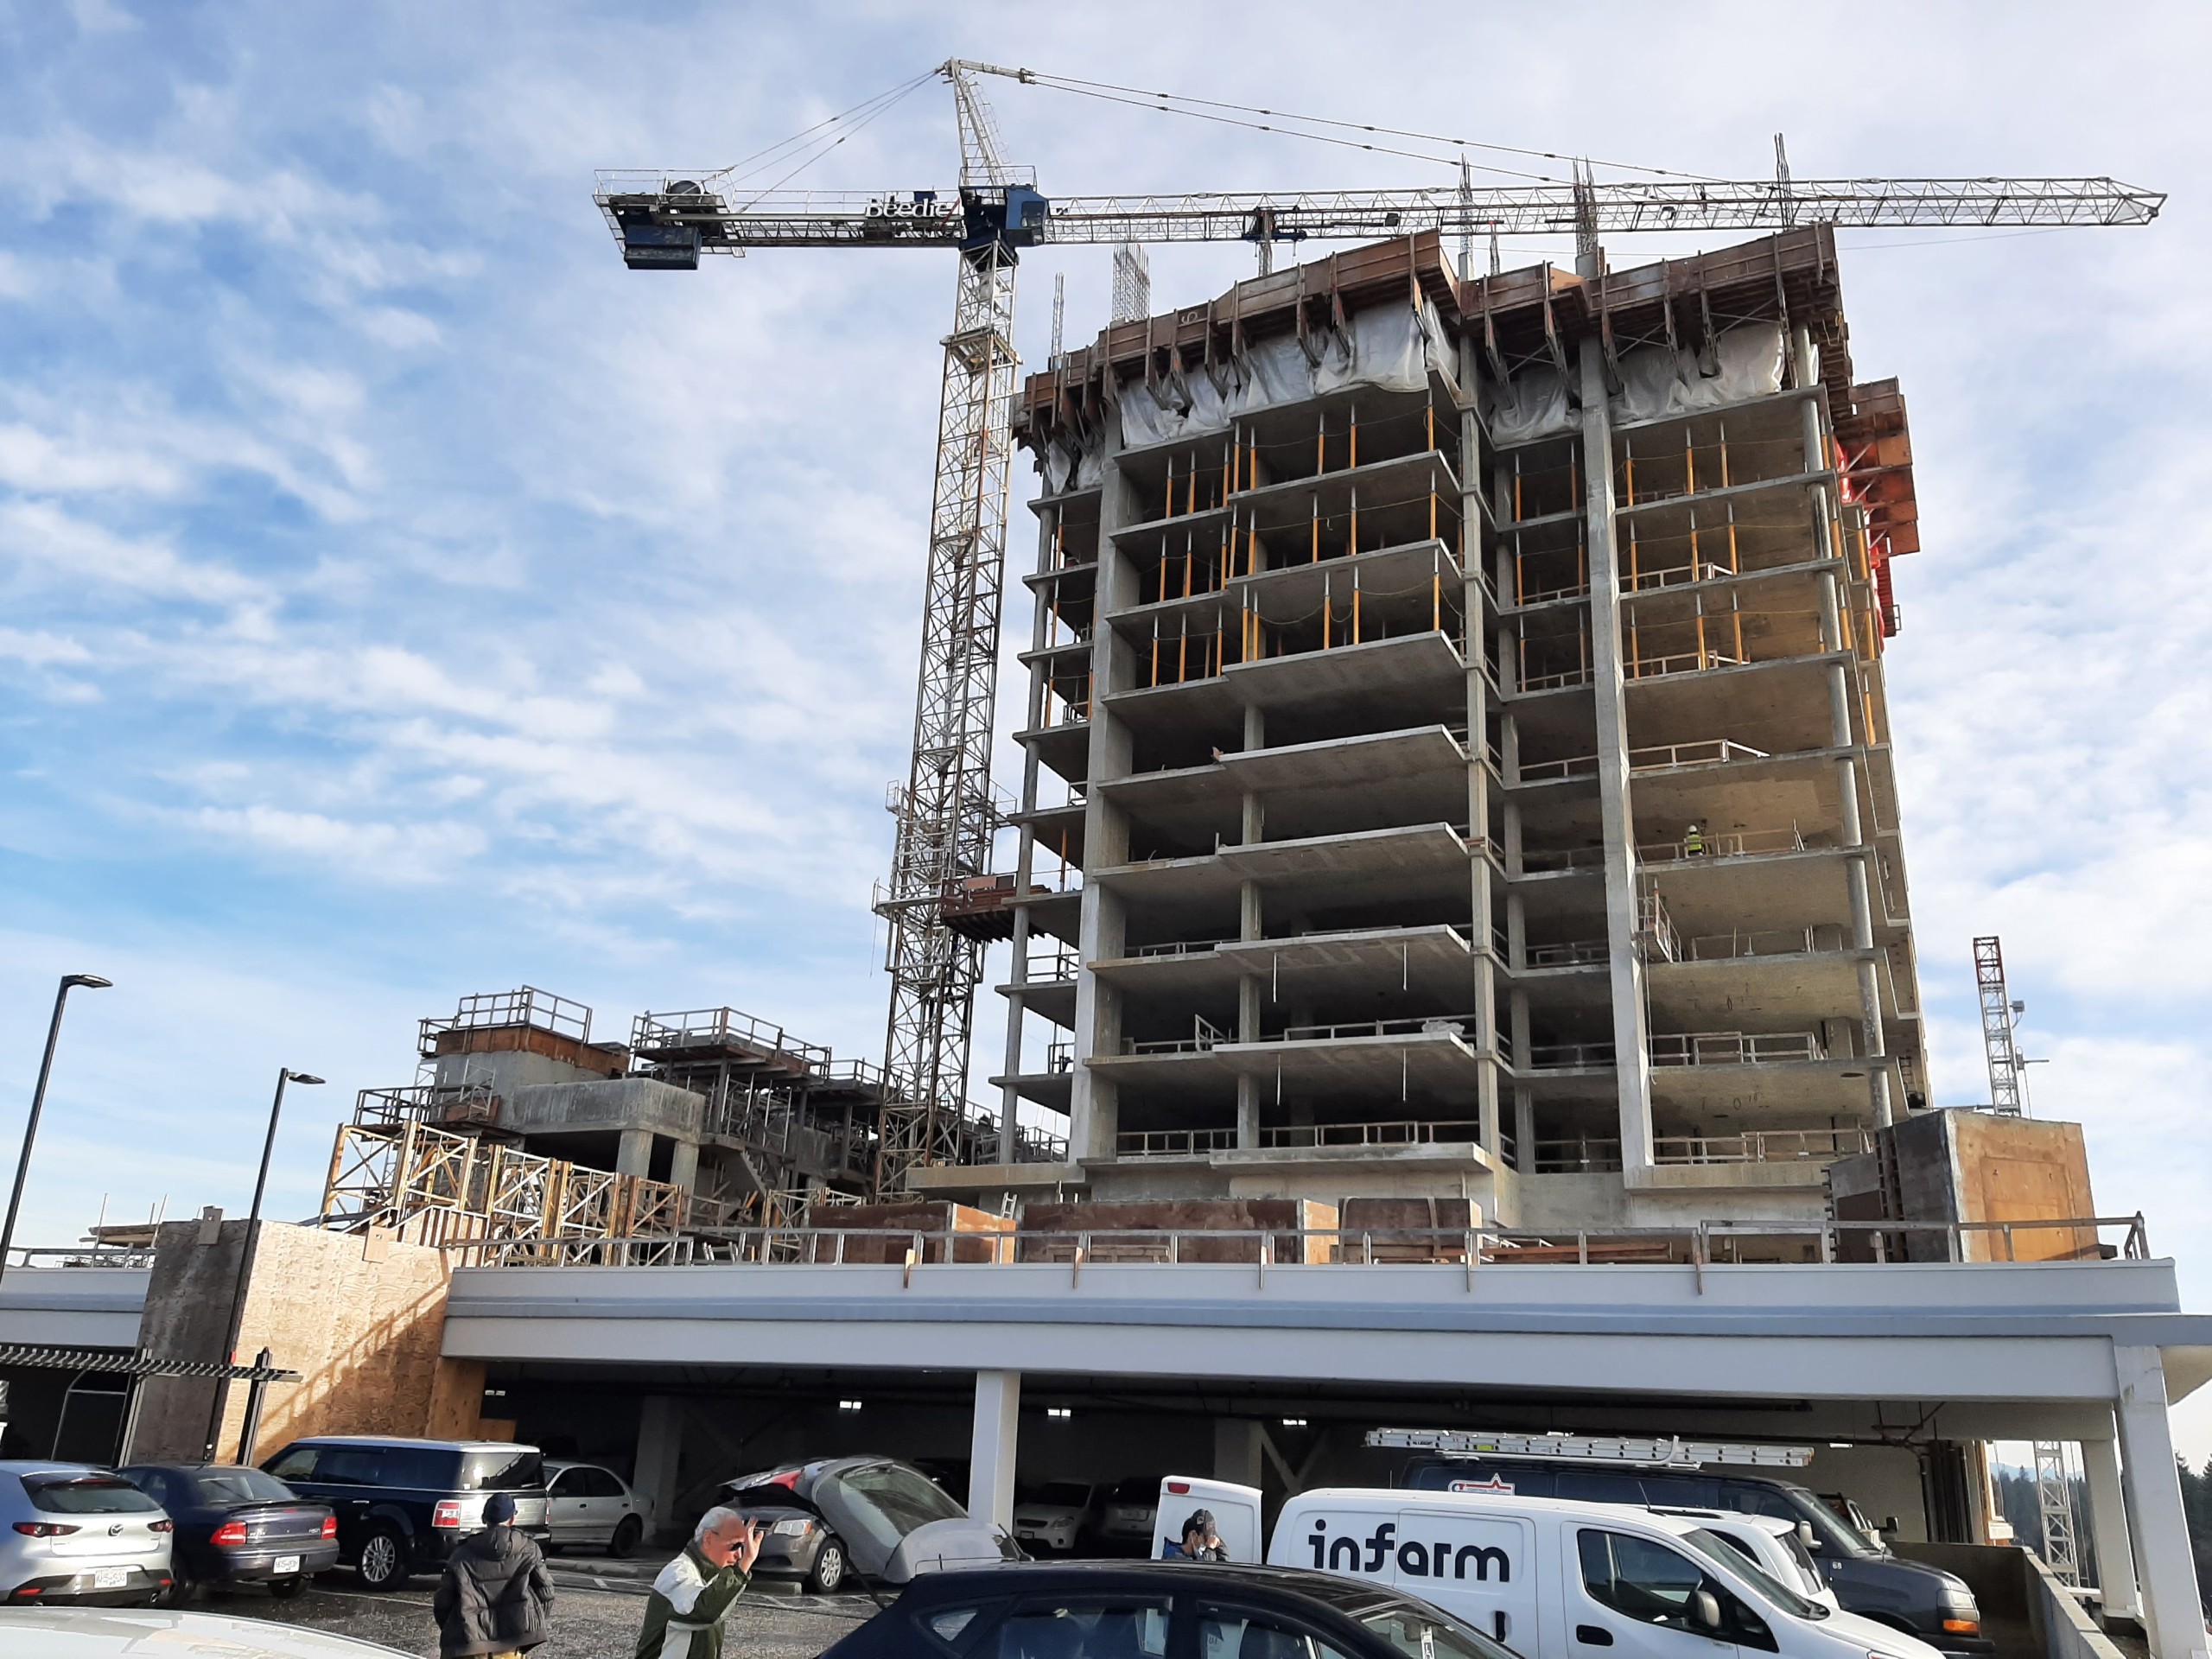
How much housing is your municipality building – and how much more is needed?
A new online database is attempting to help both voter and municipal council candidates get a better understanding of both the amount and the type of housing being built in cities across B.C.
Voters can get a snapshot of the housing completed across the Tri-Cities between 2015 and 2021 as well as information on the number of households on a B.C. Housing waitlist.
Local news that matters to you
No one covers the Tri-Cities like we do. But we need your help to keep our community journalism sustainable.
Coquitlam
- Condo and homeowner: 8,048
- Co-op and rental social: 0
- Rental market: 1,577
There are 921 Coquitlam households on the B.C. Housing waitlist, including 122 people with disabilities.
The rate of non-market housing construction sharply, going from 43 non-market units built between 2010 and 2020 to 559 in construction or permitting stages in 2021.
Port Moody
- Condo and homeowner: 602
- Co-op and rental social: 0
- Rental market: 406
From 2013 to 2019, the number of households waiting for non-market housing rose 41 percent. Between 2008 and 2018, overall median rents jumped by 45 percent,
Port Coquitlam
- Condo and homeowner: 1,660
- Co-op and rental social: 0
- Rental market: 646
As of 2021, 292 individuals and families were on the B.C. housing waitlist for non-market housing, an 87 percent increase from 2013.
The database was created by the B.C. Non-Profit Housing Association, the Co-operative Housing Federation of B.C., and the Aboriginal Housing Management Association
Speaking to Province reporter Joanne Lee-Young, Co-op Housing Federation of B.C. CEO Thom Armstrong emphasized the gap between the supply and demand.
“The most striking thing is that not a single municipality has been able to experience completions that come close to the need and the demand that’s out there,” Armstrong said.
To use the database, click on Local Snapshot and scroll to find the name of your municipality.
Author

Related Articles

Developers donate nearly $200,000 to Tri-City candidates in 2022 elections
Port Moody only city where industry donations have increased since corporate donations were banned